


5 Books to Help you Improve your Data Visualization & Communication Skills


One of the most overlooked yet critical skills in Data Science and Analytics is mastering Data Visualization and Communication. While data analysis and technical know-how are essential, the ability to lay out insights through clear, compelling visuals can be a game changer. In fact, no matter how sophisticated your analysis, if your results aren’t communicated effectively, your work may not have the impact it deserves due to lack of knowledge / perception by stakeholders.
It’s not enough to simply analyze data. To excel in any data role, you need to understand how to bridge the gap between numbers and meaningful conclusions. Data scientists, analysts, and business intelligence professionals are constantly tasked with interpreting vast amounts of data, but the true challenge lies in making that information digestible and actionable for stakeholders. This is where data storytelling comes into play.
Presenting insights to non-technical audiences is a must for excelling in most data roles. Whether you’re working with senior management, marketing teams, or external clients, the ability to communicate data-driven insights effectively can set you apart from your peers.
So, how can you improve? In this blog post, we will explore five excellent books that can elevate your Data Visualization and Communication skills. Investing time in developing these skills will bridge the gap between your technical work and the ability to influence and drive real business outcomes.
Let’s go!
Storytelling with Data: A Data Visualization Guide for Business Professionals
Thoughtfully crafted and easy to digest, Storytelling with Data emphasizes the idea that data on its own isn’t enough — how you communicate it makes all the difference. Knaflic encourages readers to think beyond charts and graphs, highlighting the importance of crafting a compelling narrative that engages the audience.
One of the strengths of this book is its practical approach. Knaflic walks the reader through common pitfalls in data visualization, such as cluttered visuals, misaligned axes, and irrelevant details that distract from the core message. She emphasizes the concept of simplicity, where less is often more.
In addition to simplifying visuals, Knaflic stresses the importance of audience focus. A common mistake in data communication is to overwhelm people with too much information. Knaflic urges data professionals to always ask themselves, “Who is my audience?” and “What do they need to know?” Tailoring your message to meet your audience’s needs ensures that your work lands with maximum impact.
Find it here:
Storytelling with Data on Amazon.com
The Visual Display of Quantitative Information
Edward Tufte’s The Visual Display of Quantitative Information is a foundational work in the field of data visualization. This book set the stage for modern approaches to visualizing data, emphasizing both the artistry and the science behind effective data communication. First published in 1983, it remains highly relevant today.
One of the central ideas in Tufte’s book is the importance of precision and integrity in data representation. He coined the term “chartjunk” to describe unnecessary decorations or embellishments that clutter visualizations and detract from the message the data is trying to convey.
Tufte also introduces the concept of data-ink ratio, a guiding principle for creating clean, efficient visualizations. He argues that only the ink that directly represents data should remain in a graph, while anything non-essential should be minimized or removed altogether. Specially, one of the most compelling aspects of The Visual Display of Quantitative Information is that it challenges the reader to think about data visualization as a form of communication and persuasion.
Find it here:
The Visual Display of Quantitative Information on Amazon.com
Info We Trust: How to Inspire the World with Data
Info We Trust: How to Inspire the World with Data is an exploration of how data can be used to tell stories and inspire action.
Written by RJ Andrews, this book blends artistry and analysis, offering a perspective on how to communicate insights through data. First published in 2019, it introduces readers to the power of thoughtful data visualization in shaping how we understand and act on information. This book is highly leaned on the storytelling part of data, helping readers gain a fresh perspective on how to present data narratives.
Andrews emphasizes the importance of creativity and narrative in making data engaging and persuasive. You’ll also get encouragement to go beyond traditional methods and explore ways to make data memorable and impactful. It’s a great call to action for anyone looking to inspire others with data, showing that with the right approach, data can speak to both the intellect and the imagination — something that is often left on the sidelines, particularly in most presentations.
Find it on:
Info we Trust on Amazon
Show Me the Numbers: Designing Tables and Graphs to Enlighten
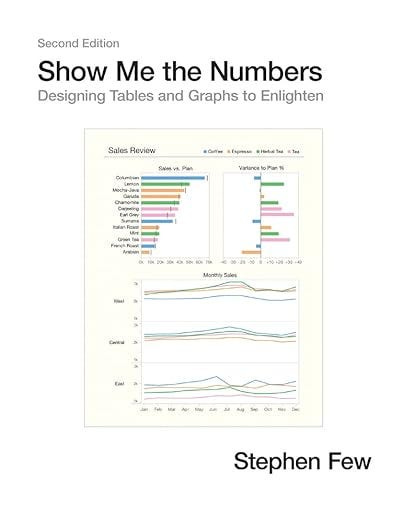
First published in 2004, this book takes a clear, no-nonsense approach to designing effective tables and graphs, focusing on clarity, accuracy, and usefulness.
Few’s central argument is that data should be presented in a way that enlightens the audience, not confuses them. He speaks about how overly complex or decorative visuals that obscure the message, advocating instead for simplicity and focus.
This book is a good follow up on Tufte’s book that you see on this list. Much like the former, Few stresses the importance of avoiding unnecessary clutter and prioritizing the data itself (a common skill to develop). One of the book’s greatest strengths is its hands-on guidance, with examples and best practices for creating visuals that are both informative and easy to understand — you can pick up the book and start to implement some of its guidelines in a programming language (Python, R, etc.) or viz tool (PowerBI, Tableau) immediately. Although it doesn’t contain practical examples, you can use the best practices in any framework or tool.
Find it on:
Show me the Numbers on Amazon
Talk Like Ted
The most outside of the box choice of this list.
Talk Like TED: The 9 Public-Speaking Secrets of the World’s Top Minds is a masterclass in the art of public speaking, drawing lessons from some of the most captivating TED Talks ever delivered.
First published in 2014, the book dives into practical advice for effective and impactful communication. Particurlarly if you want to master data storytelling, you need to become an effective communicator.
At the heart of Talk Like TED are nine principles that the author identifies as the foundation for delivering unforgettable presentations. These include storytelling, emotional engagement, and the importance of passion and body language. Gallo emphasizes that successful speakers don’t just share information — they connect with their audience on a deeper level, making their ideas resonate in a way that inspires action and change. In a way, this is very similar to how we, as data practicioners, should connect to our stakeholders.
With its combination of research, real-world examples, and actionable tips, Talk Like TED is a greatresource for anyone looking to enhance their communication skills and leave a lasting impression on their future audiences.
Find it on:
Talk Like Ted on Amazon
That’s it!
I think it’s becoming even more clear that mastering data communication is a critical skill for anyone that wants to excel in the data science and analytics space.
These books offer a variety of perspectives, from practical design techniques to the art of storytelling, giving you the tools to make your insights stand out.
If you have any favorite resources — books, blogs, courses — that have helped you improve your data communication skills, I’d love to hear about them. Drop them in the comments, and let’s keep this conversation going :-)